Architect Components
Following figure shows high-level achitecture of Architect system.
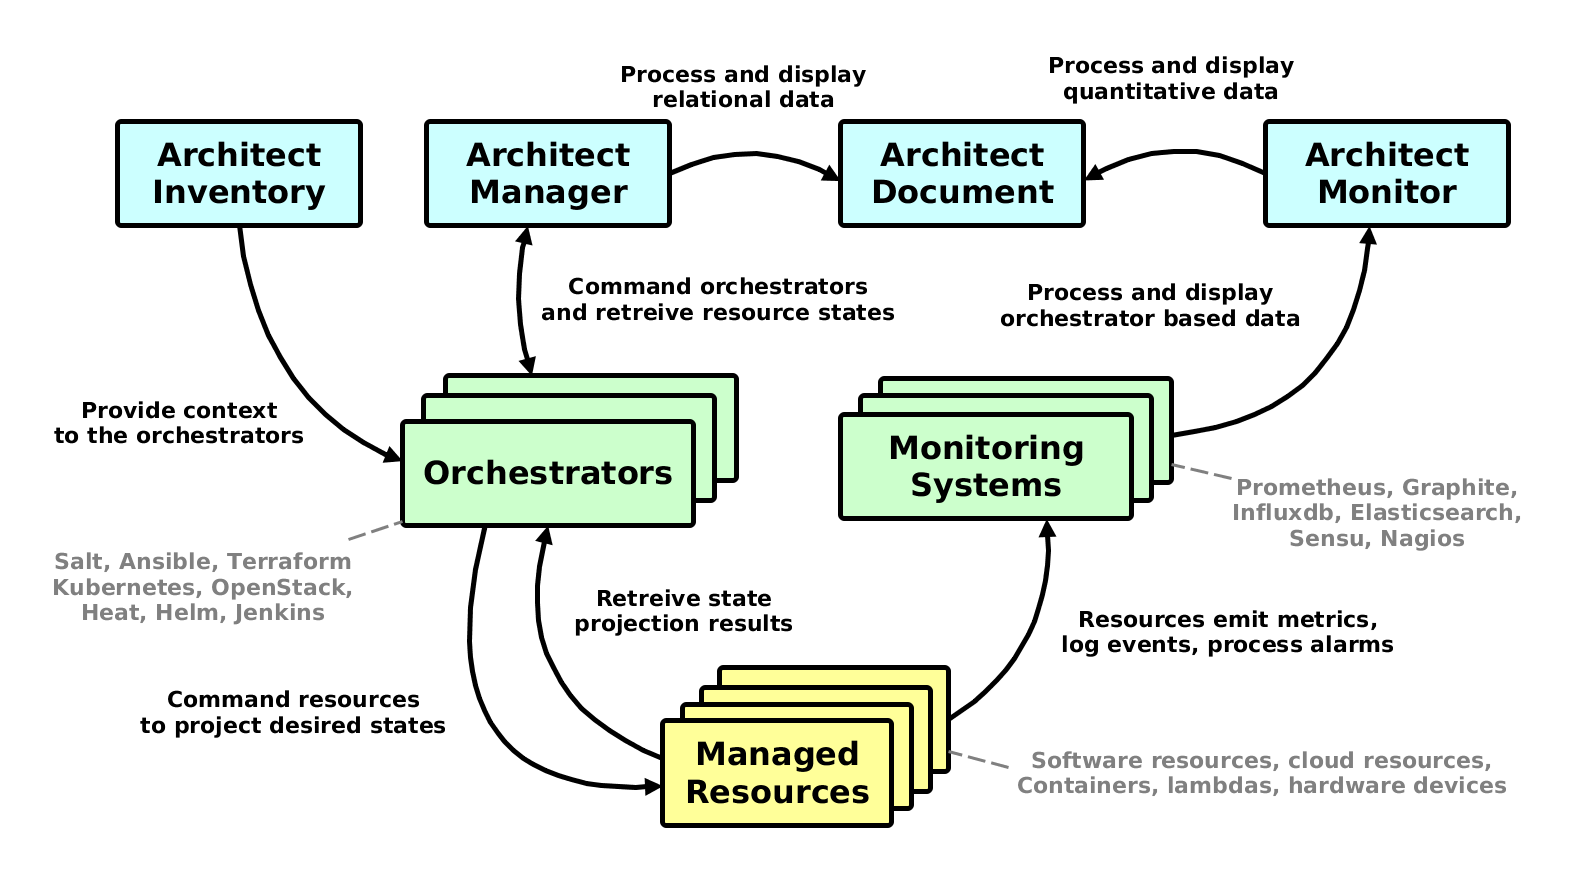
High-level achitecture of Architect system
The Architect project consists of 4 core compontents. A quick summary of properties, capabilities and integrations for each component.
Inventory Component
Inventory is the Architect’s metadata engine. It encapsulates and unifies data from various metadata sources to provide inventory metadata for various orchestration services. Basically serves as metadata proxy with clients. It works best integrated with http://salt-formulas.readthedocs.io/.
Currently supported metadata backends are:
- salt-formulas
- reclass (python3 version)
The currently supported customers of metadata provided by Inventory using
architect-api client library are:
- SaltStack
- Ansible
- Puppet
- Chef
Following orchestrators have direct support for injecting context metadata:
- Heat
Manager Component
Manager is the Architect’s orchestration engine. The aim of this module is to enforce infrastructure topologies models and acquire live infrastructure topology data from any resource provider for further relational and quantitative analysis and visualisations.
The pull approach for querying endpoint APIs is supported at the moment, the processing push from target services is supported for SaltStack events.
Currently supported resource providers are:
- Kubernetes clusters
- OpenStack clouds
- Heat templates
- Amazon web services
- SaltStack infrastructures
- Terraform templates
- Jenkins pipelines
Monitor Component
Monitor is the Architect’s monitoring engine. It can connect to multiple data endpoints and subject them for further analysis. We can define queries for quantitative data or time-series in Document component.
Currently supported monitoring services are:
- Graphite
- ElasticSearch
- Prometheus
- InfluxDB
Document Component
Document component is responsible for analysis and visualization of infrastructure resources in form of directed graph. We can perform several transformation functions on this graph data. The other part is analysis of quantitative data provided by monitoring solutions and corellating it to the relational structures provided by Manager component.
Currently supported relational visualization layouts:
- Adjacency matrix
- Arc diagram
- Force-directed graph
- Hierarchical edge bundling
- Hive plot
- Circle packing
- Node-link tree (Reingold-Tilford tidy trees, dendrograms)
- Partition layout (sunburst, icicle diagrams, treemaps)
- Sankey diagram
Currently supported quatitative visualization layouts:
- Line chart
- Bar chart, stacked bar chart
- Horizon chart
- Donut chart, pie chart