Visual Infographics
It is useful to identify three main categories of data visualizations in terms of what their main (intended or unintended) purpose is.
Inspirational
The main goal here is to inspire people. To wow them! But not just on a superficial level, but to really engage people into deeper thinking, sense of beauty and awe. Visualization has an incredible power to attract people’s attention but also to draw them into fantastic artificial worlds that turn abstract concept into more tangible ones.
Explanatory
The main goal here is to use graphics as a way to explain some complex idea, phenomenon or process. This is an area where graphical representation shines: we are visual creatures and a picture is sometime really worth a thousand words.
Analytical
The main goal here is to extract information out of data with the purpose of answering questions and advancing understanding of some phenomenon of interest. Sure, explanatory visualization is also about helping people understand something.
But the main difference here is that in explanatory visualization the author knows already what to visualize (after having performed some analysis), whereas in analysis the main use of visualization is to understand the data in the first place.
Data analysis is important because it can help people improve their understanding of complex phenomena in our case service models and can help solve important problems around it. It’s an indirect link, but an important one: If I understand a problem better, there are higher chances I can find a better solution for it.
Core Presentation Libraries
d3.js
D3 (or D3.js) is a JavaScript library for visualizing data using web standards. D3 helps you bring data to life using SVG, Canvas and HTML. D3 combines powerful visualization and interaction techniques with a data-driven approach to DOM manipulation, giving you the full capabilities of modern browsers and the freedom to design the right visual interface for your data.
- https://github.com/d3/d3
- http://bost.ocks.org/mike/chart/ Towards Reusable Charts
- https://bocoup.com/blog/reusability-with-d3 Exploring Reusalibility with D3.js
- https://github.com/springload/react-d3-integration An example on how to integrate D3 into React
- http://bl.ocks.org/biovisualize/8187844 direct svg to canvas to png conversion
- http://bl.ocks.org/vicapow/758fce6aa4c5195d24be An example of creating a PNG from an SVG in D3.
Presentation Helper Libraries
d3 layouts
- http://blog.visual.ly/cartesian-vs-radial-charts/ Battle of the Charts: Why Cartesian Wins Against Radial
- http://bl.ocks.org/giuliano108/7482331 d3.layout.colgrid
- https://bl.ocks.org/feyderm/ba5a80beec95ff39b5267554b590993f A change of perspective…
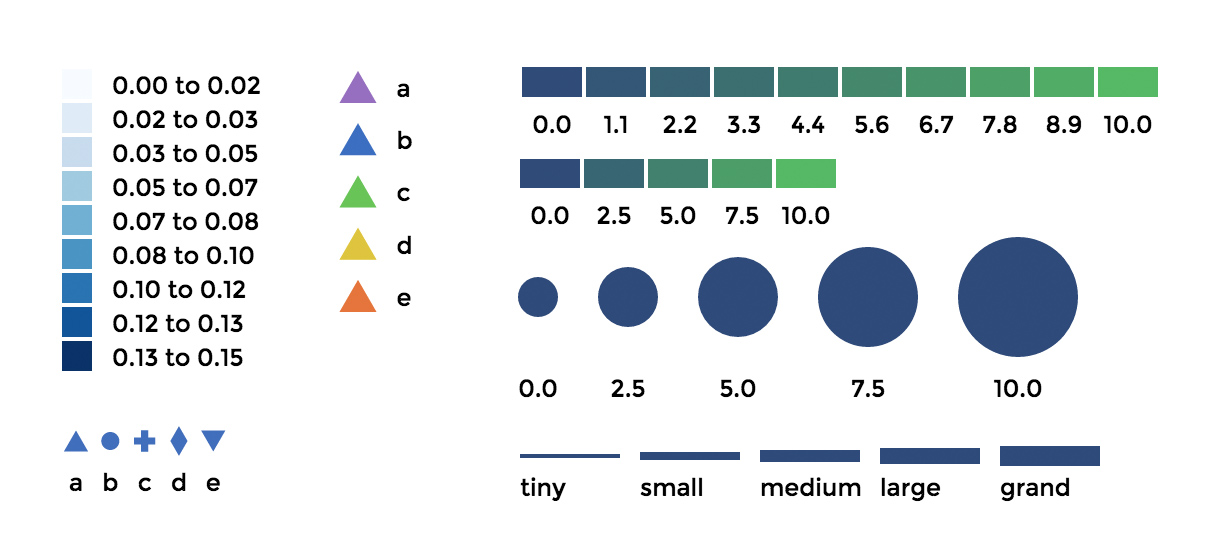
d3-legend
A library to make graph legends.
d3-annotation
Annotations establish context, and direct our users to insights and anomalies.
