Hierarchical Visualizations
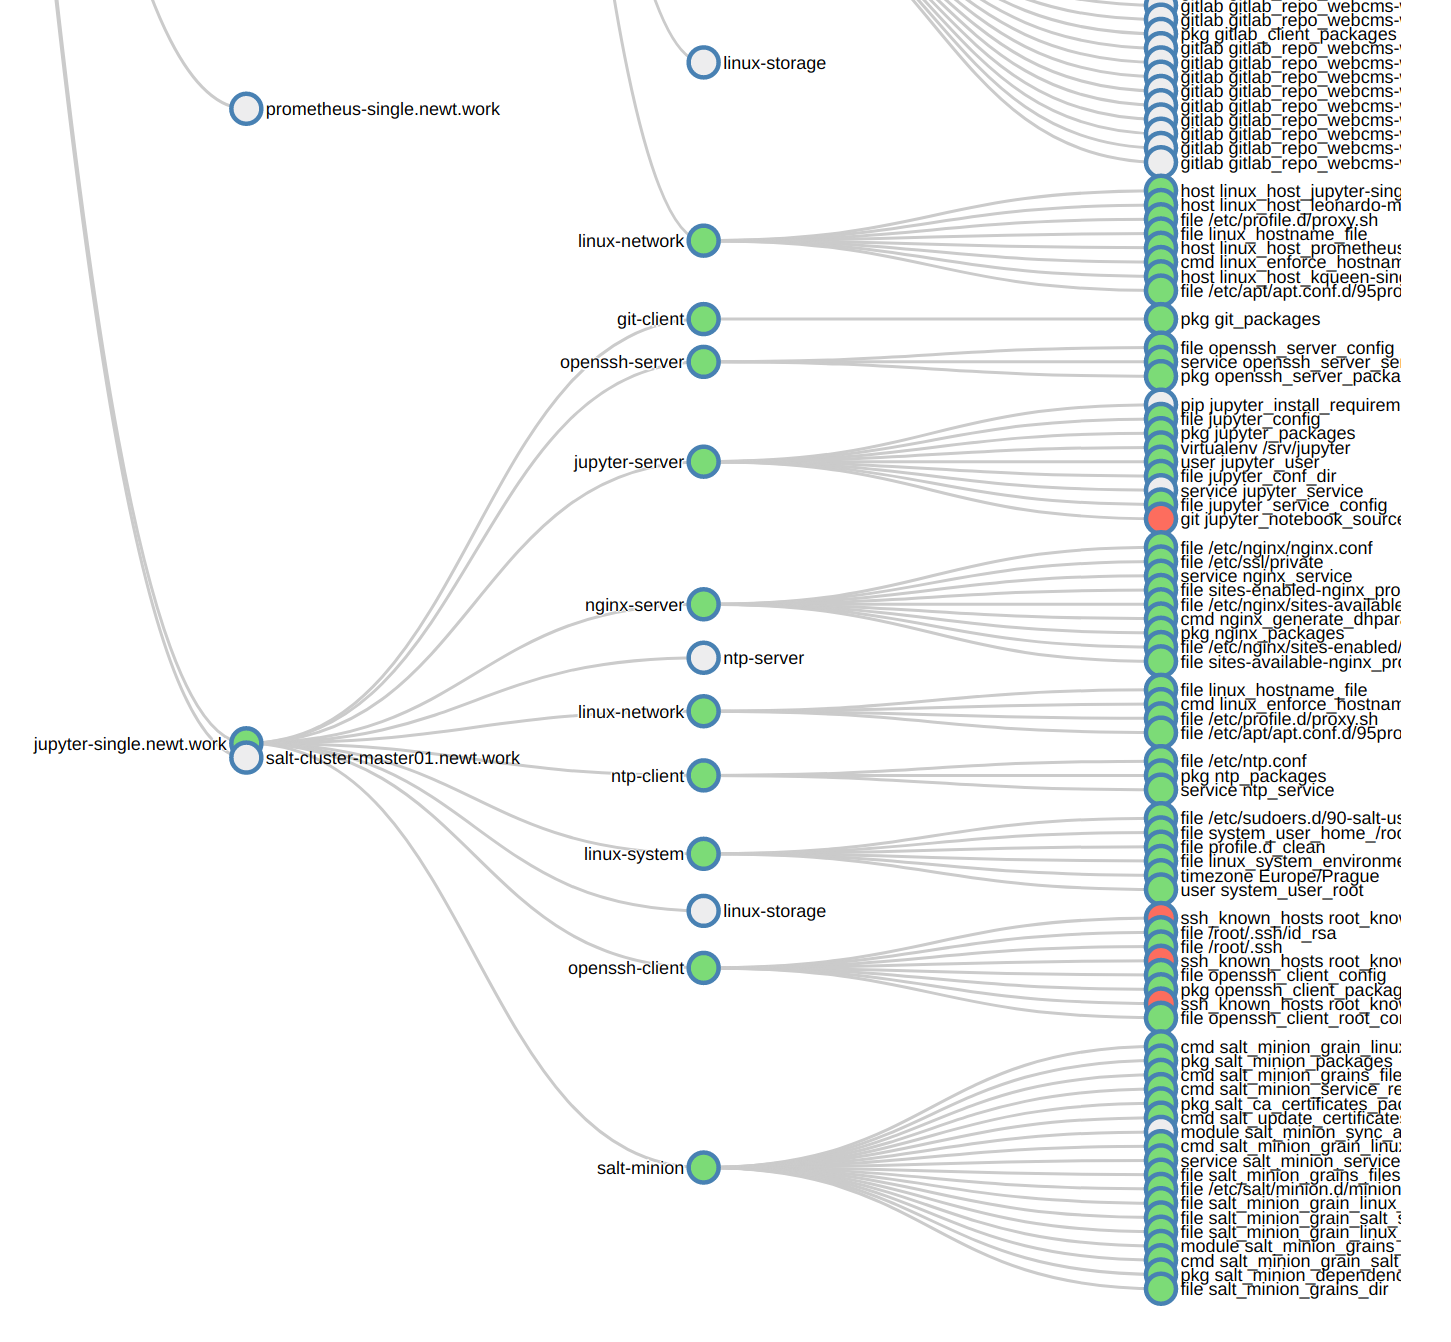
Tree graphs are frequently drawn as node-link diagrams in which the vertices are represented as disks, boxes, or textual labels and the edges are represented as line segments, polylines, or curves in the Euclidean plane.
Node-link diagrams can be traced back to the 13th century work of Ramon Llull, who drew diagrams of this type for complete graphs in order to analyze all pairwise combinations among sets of metaphysical concepts.
Dendrogram, Reingold–Tilford Tree
The dendrograms are node-link diagrams that place leaf nodes of the tree at the same depth. Dendograms are typically less compact than tidy trees, but are useful when all the leaves should be at the same level, such as for hierarchical clustering or phylogenetic tree diagrams.
SaltStack services in Hierarchical edge bundle
References
- https://en.wikipedia.org/wiki/Dendrogram
- https://en.wikipedia.org/wiki/Radial_tree
- http://ncss.wpengine.netdna-cdn.com/wp-content/themes/ncss/pdf/Procedures/NCSS/Hierarchical_Clustering-Dendrograms.pdf
- http://www.meccanismocomplesso.org/en/dendrogramma-d3-parte1/
- https://bl.ocks.org/mbostock/4063570 Cluster Dendrogram
- http://bl.ocks.org/mbostock/4063550 Radial Reingold–Tilford Tree
- http://bl.ocks.org/mbostock/4339184 Reingold–Tilford Tree
Sunburst Chart
A ring chart, also known as a sunburst chart or a multilevel pie chart, is used to visualize hierarchical data, depicted by concentric circles. The circle in the centre represents the root node, with the hierarchy moving outward from the center. A segment of the inner circle bears a hierarchical relationship to those segments of the outer circle which lie within the angular sweep of the parent segment.
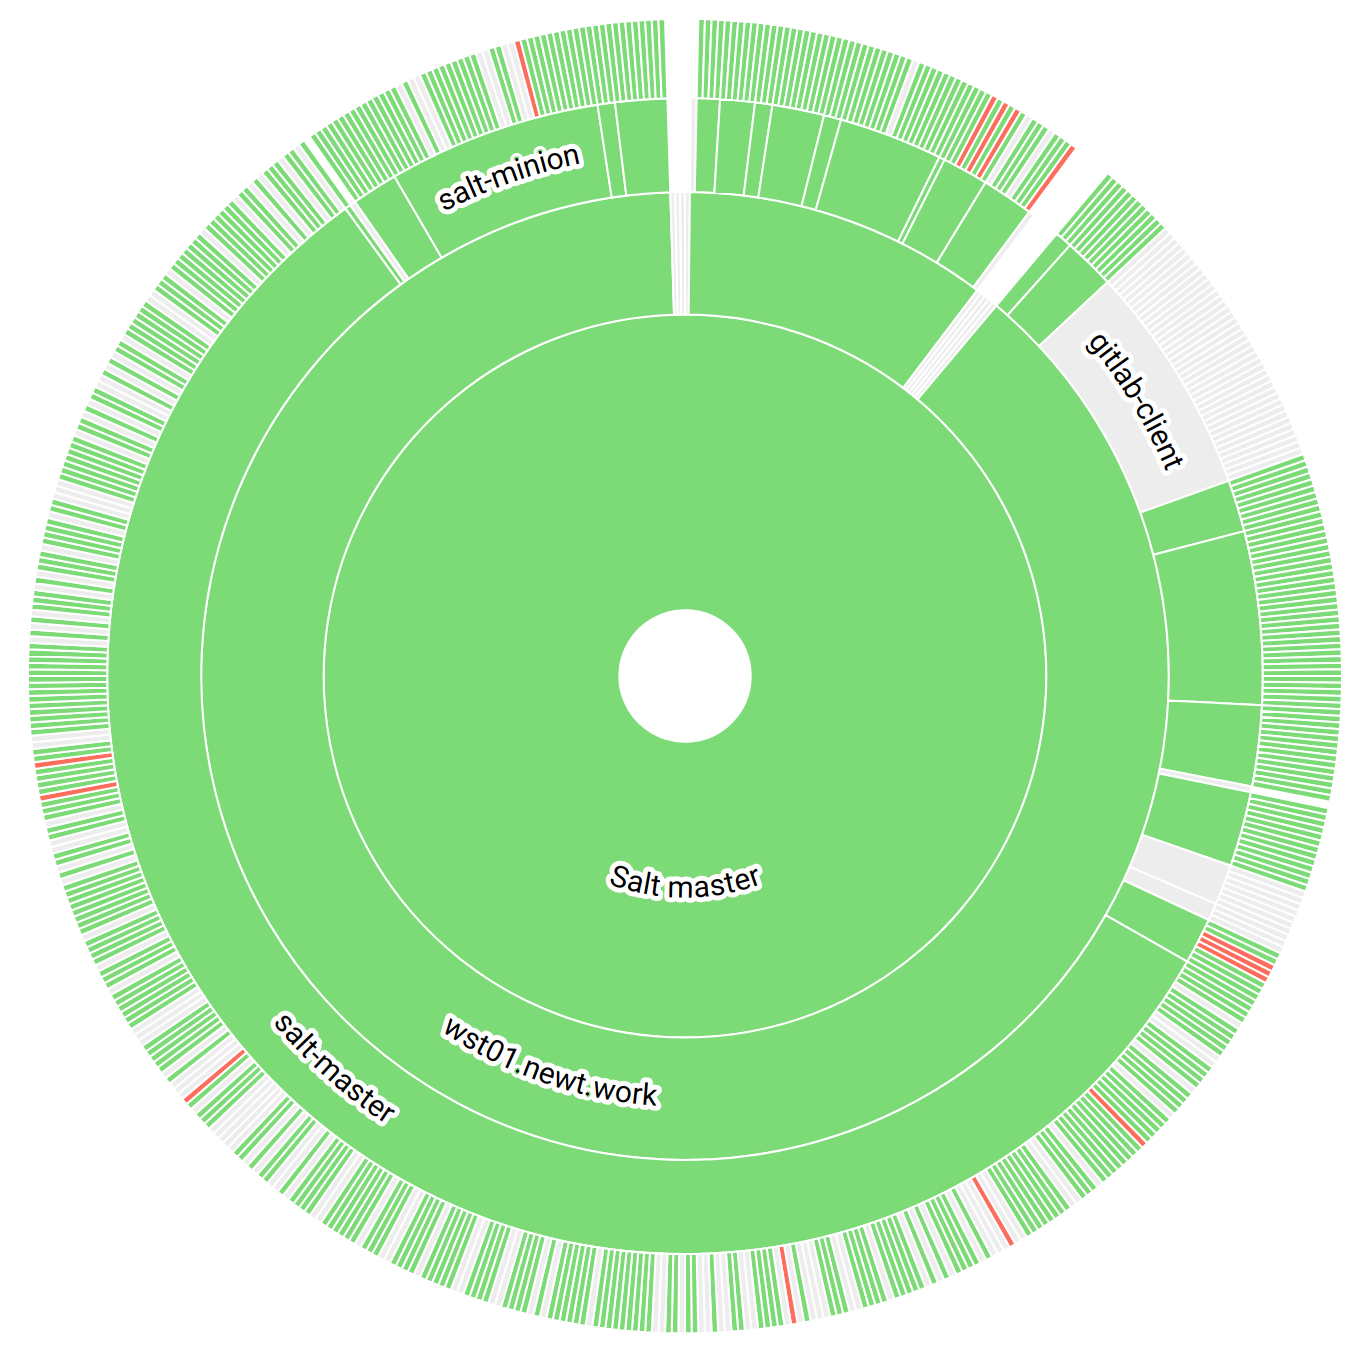
SaltStack services in Sunburst Diagram
The partition layout produces adjacency diagrams: a space-filling variant of a node-link tree diagram. Rather than drawing a link between parent and child in the hierarchy, nodes are drawn as solid areas (either arcs or rectangles), and their placement relative to other nodes reveals their position in the hierarchy. The size of the nodes encodes a quantitative dimension that would be difficult to show in a node-link diagram.
References
- https://en.wikipedia.org/wiki/Pie_chart
- https://bl.ocks.org/mbostock/4063423 Sunburst Partition
Circle Packing
Circle packing in a circle is a two-dimensional packing problem with the objective of packing unit circles into the smallest possible larger circle. Resources lower in hierarchy are diaplayed as circles with lower-level resources as inner circles.
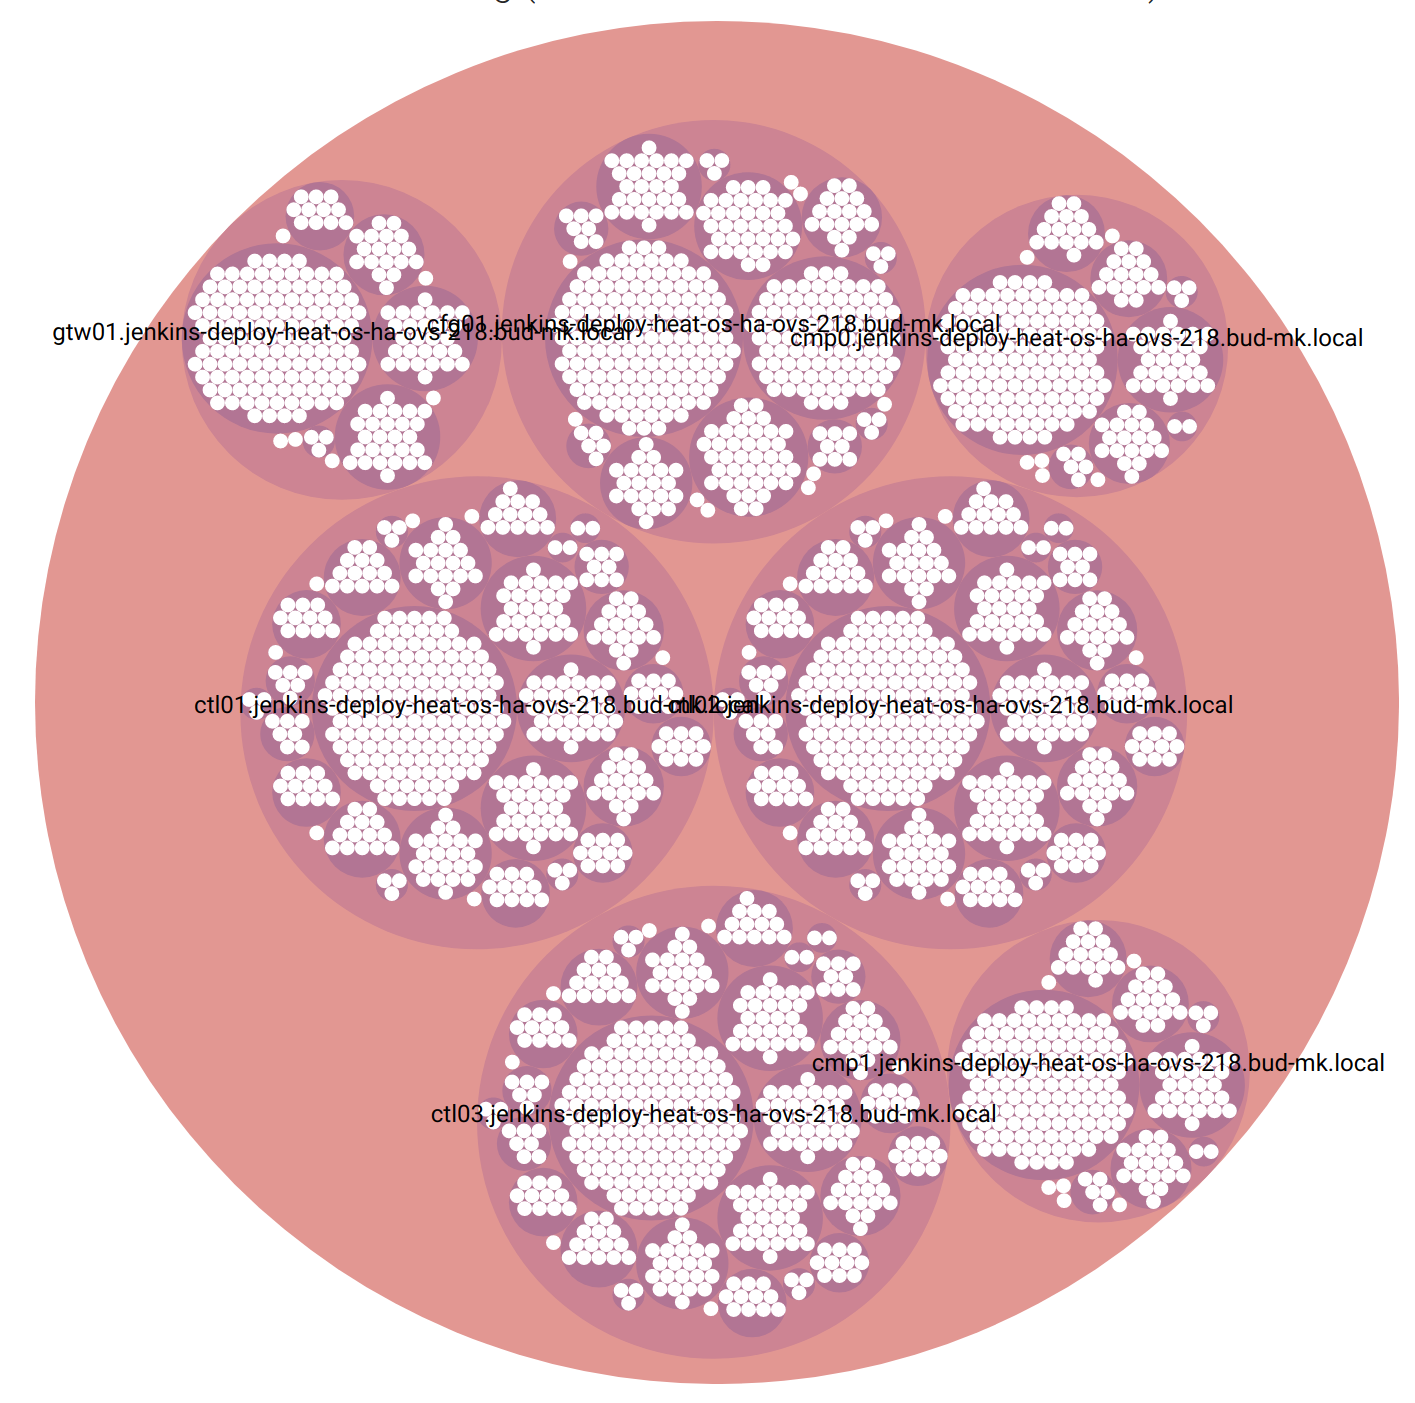
SaltStack services in Circle Packing
References
- https://en.wikipedia.org/wiki/Circle_packing_in_a_circle
- https://bl.ocks.org/mbostock/7607535 Zoomable Circle Packing
- http://bl.ocks.org/vicapow/3d24f96c240eeb8d14e3 circle packing with depth dependent padding
Treemap
Treemap is a space-constrained visualization of hierarchical structures. It is very effective in showing attributes of leaf nodes using size and color coding. Treemap enables users to compare nodes and sub-trees even at varying depth in the tree, and help them spot patterns and exceptions. Treemap was first designed by Ben Shneiderman during the 1990s. For more information, read the historical summary of treemaps, their growing set of applications, and the many other implementations. Treemaps are a continuing topic of research and application at the HCIL.
When the color and size dimensions are correlated in some way with the tree structure, one can often easily see patterns that would be difficult to spot in other ways, such as if a certain color is particularly relevant. A second advantage of treemaps is that, by construction, they make efficient use of space. As a result, they can legibly display thousands of items on the screen simultaneously.
Voronoi Treemap
Voronoi treemaps are an alternative to traditional rectangular treemaps for visualizing hierarchical data. Like rectangular treemaps, Voronoi treemaps represent hierarchical data by dividing the canvas region into cells for each node at the top of the hierarchy, and then further dividing each of these cells for the children of those nodes. The organic shapes created by the Voronoi treemap can be easier to distinguish sibling nodes from nodes in other branches of the hierarchy. Voronoi treemaps can also be fit to non-rectangular canvases, and are often more aesthetically pleasing.
Orbital Layout
An animated hierarchical layout that creates orbits from nested data.
- https://github.com/emeeks/d3.layout.orbit
- http://bl.ocks.org/emeeks/068ef3e4106e155467a3 Orbital Layout of D3.js API